Thursday, 28 November 2024

Housing Completions Since the 1950's


The story of UK housing completions over the last 70 years is a tale of shifting responsibilities and changing priorities. As this chart shows, local authorities played a leading role in building new homes during the 1950s and 1960s, particularly in the form of council houses. 


However, from the late 1970s onwards, this role diminished significantly, largely due to policy changes and funding cuts. In their place, housing associations emerged, attempting to fill the gap in social housing, but even they rely heavily on government funding to meet their goals.


Meanwhile, private enterprises have maintained a steady contribution to housing completions, yet it's clear they alone cannot meet the government’s ambitious target of 300,000 new homes per year. To reach numbers comparable to those seen in the mid-20th century, a significant scale-up is required, but who will be responsible for this surge? Who will pay for it?


Both housing associations and local authorities depend on government resources, and with limited funding, it's uncertain whether they can rise to the challenge.


This raises a pressing question for us locally. If Huddersfield is to play its part in meeting these targets, where should these new homes be built? We face a complex balancing act between preserving green spaces, ensuring infrastructure can cope, and providing the quality housing our community needs. 


So, we ask: if we must build more homes in Huddersfield, where should they go?

Tuesday, 26 November 2024

UK Households 1996 - 2023

The composition of UK households has evolved significantly between 1996 and 2023, with some subtle yet meaningful proportional shifts that reflect changing demographics and societal trends.


For couples with children, their share of total households has dropped from 31.1% in 1996 to 27.9% in 2023, a proportional decrease of approximately 10.3%. This reflects lifestyle changes, including delayed parenthood and smaller family sizes.


In contrast, one-person households have risen from 27.8% to 29.6%, a proportional increase of 6.5%. This growth likely reflects an ageing population, as well as more individuals choosing to live alone due to greater financial independence or personal preference.


Couples without children have seen a smaller proportional increase, rising from 27.4% to 28.1%, an increase of just 2.6%. This stability underlines the continuing trend of dual-income households and couples choosing alternative priorities to raising children.


Lone-parent households, meanwhile, have grown from 9.9% to 10.6%, a proportional rise of 7.1%.


Interestingly, households with two or more unrelated adults have seen a proportional decline of 6.5%, decreasing from 3.1% to 2.9%, potentially reflecting challenges such as rising housing costs or changing rental practices.


Multi-family households, although still rare, have increased from 0.7% to 1.0%, a proportional jump of 42.9%, likely driven by economic pressures and the resurgence of multigenerational living. These proportional changes, though subtle, provide insights into the UK’s shifting household dynamics. 


For towns like Huddersfield, they highlight the importance of tailored housing policies and estate agency services that respond to evolving needs, including single-person housing, multigenerational homes, and affordability concerns.


This information is important for lots of people; including national and local government for the provision of services and future housing, buy-to-let investors knowing what sort of demand there will be different types of properties in the future and finally any homeowners wanting to know how demographic changes will affect the property market and house prices in the long term.

 The composition of UK households has evolved significantly between 1996 and 2023, with some subtle yet meaningful proportional shifts that reflect changing demographics and societal trends.


For couples with children, their share of total households has dropped from 31.1% in 1996 to 27.9% in 2023, a proportional decrease of approximately 10.3%. This reflects lifestyle changes, including delayed parenthood and smaller family sizes.


In contrast, one-person households have risen from 27.8% to 29.6%, a proportional increase of 6.5%. This growth likely reflects an ageing population, as well as more individuals choosing to live alone due to greater financial independence or personal preference.


Couples without children have seen a smaller proportional increase, rising from 27.4% to 28.1%, an increase of just 2.6%. This stability underlines the continuing trend of dual-income households and couples choosing alternative priorities to raising children.


Lone-parent households, meanwhile, have grown from 9.9% to 10.6%, a proportional rise of 7.1%.


Interestingly, households with two or more unrelated adults have seen a proportional decline of 6.5%, decreasing from 3.1% to 2.9%, potentially reflecting challenges such as rising housing costs or changing rental practices.


Multi-family households, although still rare, have increased from 0.7% to 1.0%, a proportional jump of 42.9%, likely driven by economic pressures and the resurgence of multigenerational living. These proportional changes, though subtle, provide insights into the UK’s shifting household dynamics. 


For towns like Huddersfield, they highlight the importance of tailored housing policies and estate agency services that respond to evolving needs, including single-person housing, multigenerational homes, and affordability concerns.


This information is important for lots of people; including national and local government for the provision of services and future housing, buy-to-let investors knowing what sort of demand there will be different types of properties in the future and finally any homeowners wanting to know how demographic changes will affect the property market and house prices in the long term.


Friday, 22 November 2024

UK Property Market Infographic


  • Listings (New properties coming on to the market): 29k UK listings this week (week 46). YTD 2024, listings are 8% higher compared to 2023 YTD.


  • % of Resi Sales Stock being reduced (Monthly): 13% of Resi sales stock was reduced in the last month. 14% last month and long term 5 year average 10.6%.


  • Total Gross Sales: 24.2k UK homes sold stc this week (Week 46), slightly more than last week.  19.2% higher than the same standalone week (week 46) in 2023. Also, 8.5% higher than 2017/18/19 YTD levels & 14.9% higher than 2023 YTD levels. 


  • Sale Thru rate (Monthly): UK Estate Agents sold 16.11% of their Resi sales stock in Oct ’24. Sept ‘ 24 was 14.79%. 2024 average is 15.86% & the 7 year long term average is 17.9% per month - yet don’t forget that was only in mid/late 20%’s in the crazy years of 20/21/22).


  • Sale fall-throughs: For the week 46, Sale Fall Thrus (as a % of Gross sales Agreed) dropped significantly to 25% (down from 28.8% last week). The 7 year Long Term weekly Average is 24.2% and it was 40%+ in the two months following the Truss Budget in the Autumn of 2022. Agents lost 5.8% of their sales pipeline in Oct’24 (up from 5.6% in Sept ‘ 24).


  • Net Sales: 18.1k this week (17k last week). 18.2% higher than the same week 46 in 2023, 76% higher than the same week 46 in 2022 & still 17.3% higher YTD in 2024 compared to YTD 2023.


  • % of Homes exchanging vs homes unsold: Of the 1,358,587 UK homes that left UK Estate Agents books since the 1st Jan 2024, 728,138 of them (53.6%) exchanged & completed contracts (meaning the homeowner moved and the estate agent got paid). The remaining 630,449 (46.4%) were withdrawn off the market, unsold. In essence you a flip of the coin chance of actually selling, homeowners moving and the estate agent getting paid. 


  • UK House Prices: As explained in the show, the £/sqft figure foretells and predicts the Land Registry 5 months in advance with an accuracy rating of 92%. Final October figures saw a slight jump in this important metric to £346/sq.ft. For comparison - Sept’s £339/sq.ft, August’s £338/sq.ft, and July at £341/sq.ft. This means house prices are slightly growing.


  • Resi Sales Stock on the Market: (Monthly Stat) : 725k at end of October (up from 724k at end of Sept). For comparison, Oct ’23 - 664k, Oct ’22 - 523k,  Oct ’21 - 425k, Oct ’20 - 681k, Oct ’19 - 652k.


Resi Sales Sold STC Pipeline: (Units) (Monthly Stat): 505k at end of October. For comparison, Oct ’23 - 401k, Oct ’22 - 483k,  Oct ’21 - 528k, Oct ’20 - 548k, Oct ’19 - 372k.

Saturday, 26 October 2024

UK Homes Split by Number of Bedrooms

 The graphic illustrates the distribution of UK homes based on the number of bedrooms, providing a snapshot of the current housing stock. According to the data, the majority of homes in the UK have three bedrooms, comprising 40.4% of the total. This is followed by two-bedroom homes, which make up 27.1%, and larger homes with four or more bedrooms at 21.1%. Interestingly, only 11.4% of homes are one-bedroom properties.


As an estate agent in Huddersfield, understanding the local housing market's dynamics is crucial. This data is particularly relevant for those considering selling or buying in the Huddersfield area. If you’re curious about how your Huddersfield property fits into the current market landscape or are considering a move, now is an excellent time to explore your options. For a personalised free valuation of your home in today’s market, feel free to give us a call on 01484 452314. Let’s make your next move the right one!

Monday, 21 October 2024

Huddersfield Property Market: Navigating the Rollercoaster of the Last Six Years

 The Huddersfield property market has experienced a rollercoaster ride since 2019, reflecting the unprecedented challenges and opportunities that have shaped the landscape of home buying and selling in the area. The accompanying graph vividly illustrates these dramatic fluctuations, comparing Huddersfield's monthly house sales, expressed as a percentage of the six-year (2019 to 2024) average in blue. Also on the graph in orange is the Bank of England's base rate between 2019 to 2024.


By examining this six-year time frame, we can better understand the resilience of the local market and the influence of economic factors, particularly interest rates, on property transactions.


The Pandemic’s Impact and Post-Lockdown Surge

The first significant event highlighted in the graph is the pandemic and the lockdown in early 2020. The property market in Huddersfield, like much of the country, ground to a near halt, with house sales in April 2020 alone plummeting by 83.8% below the 2019 to 2024 medium term six-year monthly average. The lockdown effectively froze the Huddersfield property market, as restrictions made it difficult for people to view properties, secure mortgages, or move homes.


However, the Huddersfield property market experienced a remarkable rebound once the lockdown measures were eased. The graph indicates a "Post Lockdown Boom," with sales soaring in some months to 49.5% above the six-year monthly average by mid/late 2020. This surge can be attributed to pent-up demand, government incentives like the Stamp Duty holiday, and a renewed appreciation for home ownership as people sought more space and comfort during uncertain times. This period saw extraordinary activity, with many homes selling quickly and often above the asking price.


The Truss Budget and Rising Interest Rates

The Huddersfield property market remained buoyant through 2021, although sales began to normalise in the later months of that year, fluctuating but still frequently staying above the long-term average. The shift in dynamics started in mid/late 2022, coinciding with the economic upheaval triggered by the "Truss Budget." The budget, which led to market instability and rising mortgage rates, immediately impacted buyer confidence. As a result, Huddersfield's house sales dipped below the long-term average as potential buyers paused to reassess their financial positions.


Simultaneously, the Bank of England responded to inflationary pressures by increasing the base rate, as depicted in the graph. The sharp rise in interest rates through 2022 and 2023, peaking at around 5.25% in 2023, further dampened market activity. Higher mortgage rates reduced affordability, particularly for first-time buyers, and made it more challenging for existing Huddersfield homeowners to move up the property ladder. The market cooled significantly, as seen in the negative sales percentages during this period.


Resilience and Recovery in 2024 in the Huddersfield Property Market

Despite the headwinds of higher interest rates, the Huddersfield property market in 2024 shows signs of resilience. The graph illustrates that even with these challenges, monthly sales have stabilised and are still above the long-term average, a testament to the underlying strength of the local market. It's important to note that this average includes the exceptionally high sales volumes of 2020 and 2021, making the current performance even more impressive.


In-Depth Annual Data for Huddersfield


Looking at the data for Huddersfield estate agents in the postcodes HD1-5, HD7-8:


  • 2019 - An average of 275 properties sold (stc) per month in Huddersfield, 3.0% lower than the long-term 6-year monthly Huddersfield average of 284 property sales.


  • 2020 - An average of 306 properties sold (stc) per month in Huddersfield, 7.9% higher than the long-term 6-year monthly Huddersfield average of 284 property sales.


  • 2021 - An average of 322 properties sold (stc) per month in Huddersfield, 13.4% higher than the long-term 6-year monthly Huddersfield average of 284 property sales.


  • 2022 - An average of 268 properties sold (stc) per month in Huddersfield, 5.5% lower than the long-term 6-year monthly Huddersfield average of 284 property sales.


  • 2023 - An average of 238 properties sold (stc) per month in Huddersfield, 16.1% lower than the long-term 6-year monthly Huddersfield average of 284 property sales.


  • 2024 YTD - An average of 298 properties sold (stc) per month in Huddersfield, 5.0% higher than the long-term 6-year monthly Huddersfield average of 284 property sales.


This sustained level of activity suggests that demand for homes in Huddersfield remains robust, driven by factors such as the area's appeal, the relative affordability compared to renting, and perhaps the normalisation of the work-from-home culture that allows more flexibility in where people choose to live. Furthermore, Huddersfield sellers have become more realistic with pricing, and buyers who have adjusted to the new interest rate environment continue to move forward with their plans.


Looking Ahead: A Market of Opportunity

As we move deeper into 2024, the Huddersfield property market presents opportunities for buyers and sellers. For sellers, the current conditions indicate that, despite higher interest rates, there is still strong demand for well-priced properties. On the other hand, buyers may find that the stabilising market offers a window of opportunity to secure a home before any potential further economic changes.


If you're considering moving in the next 6 to 12 months, now might be the perfect time to explore your options. Whether you're looking to downsize, find more space, or change your surroundings, I invite you to get in touch for a free, no-obligation valuation and market appraisal of your Huddersfield home. Understanding the value of your Huddersfield home in the current market is the first step to making informed decisions. Let's discuss how I can assist you in navigating this dynamic market to achieve your property goals.


The Huddersfield property market may have its ups and downs, but with careful planning and the right guidance, there are still plenty of opportunities to capitalise on this ever-changing landscape.


Wednesday, 16 October 2024

The Hard Truth About Huddersfield’s Young: Where Do They Live and What Does the Future Hold

The Hard Truth About Huddersfield’s Young:

Where Do They Live and What Does the Future Hold?

It’s no secret that the younger generation in Huddersfield is finding it tough to get onto the property ladder. With the rising cost of living, stagnating wages, and stricter mortgage criteria, it's no surprise that fewer under-34s are becoming homeowners.


But just how grim is the picture? And is there hope on the horizon for those struggling to find a place they can truly call home?


Huddersfield's Housing Crisis: The Struggles of the Under-34s


According to statistics for the Kirklees Council area, there are 177,988 households in total.


Of these, 2.7% are headed by individuals aged between 16 and 24, while 13.3% are headed by individuals aged between 25 and 34.


Compared with 2.6% of all UK households that are made up of people aged between 16 and 24 and 13.5% of all UK households made up of people aged between 25 and 34.


Looking specifically at the 16 to 24-year-old households in Kirklees, they can be broken down as follows…

  • Owned Outright – 3.9%
  • Owned with a Mortgage – 13.5%
  • Social Housing – 22.1%
  • Private Rented – 60.5%

Nationally, this compares owned outright 3.6%, owned with a mortgage 10.2%, social housing 22.8% and private renting 63.5%.


Next, the 25 to 34-year-old households in Kirklees breakdown…

  • Owned Outright – 5.5%
  • Owned with a Mortgage – 39.4%
  • Social Housing – 16.1%
  • Private Rented – 38.9%

Nationally, this compares owned outright 4.1%, owned with a mortgage 35.5%, social housing 17.7% and private renting 42.7%.


For a town like Huddersfield and local authority area, these numbers paint a rather bleak picture of property ownership among the younger generation.


But why is this happening? The answer is multifaceted. It’s not just about rising house prices (although they certainly play a role). Wages in Huddersfield have not kept pace with inflation, and with lenders becoming more conservative, the amount of deposit required to secure a mortgage is higher than ever before (not because the % of deposit is higher, just the sheer pound note amount).


For young people who are already grappling with student debt and rising rental costs, saving for a deposit can seem like an insurmountable task.


The Shifting Sands of Homeownership


Yet, while it might feel like homeownership for the under-34s in Huddersfield is slipping further out of reach, it’s worth putting these figures into context. Homeownership isn’t something that young people have ever done en masse, at least not in the recent decades of the 2000s and 2010s.


While the baby boomer generation often bought homes in their early to mid-20s (in the 1970s and 1980s), the dynamics of homeownership have changed dramatically since then.


The average age of first times buyers in the 1980s was 26, now the average age is 31 years (34 in London).


In the 1980s, when the housing market was more accessible, people were more likely to buy a home at a younger age. However, times have changed, and today's generation is navigating a very different set of economic and social circumstances. The cost of housing has skyrocketed, while wages have not kept pace. Furthermore, younger people today are often burdened with additional expenses that weren’t as prevalent a few decades ago, such as student loans and rising living costs. This combination makes it much harder to save for a deposit and secure a mortgage.


But while the statistics may seem gloomy, there’s a silver lining if we look beyond the current market and consider the long term. In countries like Germany, homeownership doesn’t typically happen until later in life. Germans tend to rent for longer, often well into their 30s and 40s, before purchasing a home. Yet, when they do finally buy, they have more financial stability, higher incomes, and can often make larger down payments. The result? Less debt and more security in the long run.


This delayed homeownership is becoming more common in the UK, and Huddersfield is no exception. What we may be seeing is not a permanent decline in young homeowners but a shift in the timing of when people buy. Instead of purchasing homes in their 20s, more people are waiting until their mid 30s or even 40s, when they have a bit more financial stability.


The Hidden £18,311,148,466 Kirklees Equity


One key factor that we cannot ignore is the £18.3bn of equity tied up in the homes of the 50 year plus older generation in Kirklees.


Many of our older residents, who bought homes decades ago when property prices were more affordable, are now sitting on this substantial equity. As these homeowners begin to downsize or pass their properties onto their children, we may see a significant transfer of wealth to the younger generation. This could provide a lifeline for many would-be homeowners who are currently priced out of the market.


In Huddersfield, where family connections are strong, and homeownership is often passed down through generations, this transfer of wealth is likely to have a profound impact on the housing market in the coming years. As baby boomers and older Gen X-ers look to pass on their properties, many younger people may find themselves with the financial means to finally purchase a home.


What Does This Mean for the Future of Huddersfield Homeownership?


The future of homeownership in Huddersfield isn’t all doom and gloom. Yes, the statistics show that fewer young people are owning homes, but this isn’t a permanent trend. The numbers may be low now, but there are several reasons to be optimistic about the future.


Firstly, as more young people start to prioritise saving and look for ways to get onto the property ladder, we could see an increase in homeownership rates among the under-34s. Previous schemes, such as Help to Buy and shared ownership can also provide much-needed assistance for first-time buyers in Huddersfield.


Secondly, as the older generation begins to pass on their wealth and property, younger people will likely have more opportunities to purchase homes, either through inheritance or through financial gifts. This generational shift will undoubtedly play a significant role in the future of Huddersfield’s property market.


While homeownership might not be happening as early as it did in previous decades, it is still very much attainable for those who are willing to plan and save strategically.


There’s no denying that the market is tough, but with the right guidance and support, many young people in Huddersfield will find that they can, in fact, become homeowners.


The key is to be patient, stay informed, and seek out opportunities as they arise.


As we look towards the future, it’s clear that the property market in Huddersfield is changing. Young people may not be buying homes as early as they did in the past, but that doesn’t mean they never will.


In fact, the next few decades could see a rise in homeownership as wealth transfers down through generations and more young people become financially stable.


In conclusion, the Huddersfield property market may be challenging for those under 34, but it is far from hopeless. The combination of shifting generational wealth and changing attitudes towards homeownership means that while young people may be delayed in buying homes, they aren’t being locked out of the market entirely.


Huddersfield’s future homeowners are out there – they’re just waiting a little longer to step onto the ladder. Share your thoughts with a comment.


Thursday, 10 October 2024

A Tale of Two Huddersfield Property Markets and the Need for Realistic Pricing


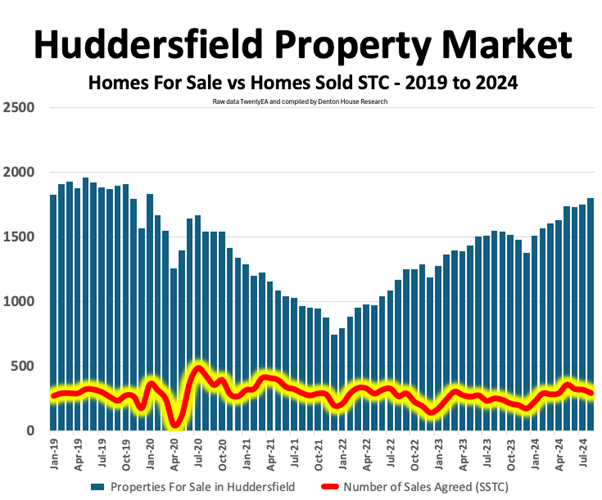
The Huddersfield property market has undergone significant changes over the past few years, as depicted in the two graphs provided. These visualisations capture the trends in the number of properties available for sale and the number of properties sold subject to contract (SSTC) from January 2019 to July 2024. By analysing these graphs, we can gain insight into the evolving dynamics of the local property market and the necessity for Huddersfield homeowners to adopt realistic pricing strategies, especially given the near doubling of available homes since mid-2022.


A Closer Look at the Huddersfield Market Dynamics (2019-2024)


From January 2019 to February 2020 (a normal market), the number of properties for sale in Huddersfield remained relatively stable, at an average of 1,847 homes (Huddersfield being HD1-5, HD7-8). This pre-COVID period also showed a steady number of properties being sold each month, with an average of 284 home sales. This indicates a balanced market where the supply of homes was more or less matched by buyer demand.


The Huddersfield property market underwent a noticeable shift with the onset of the COVID-19 pandemic in late March 2020. As the pandemic gripped the nation, the number of properties that sold in April and May 2020 plummeted sharply. This was due to the uncertainty brought about by the pandemic, with many potential buyers holding off buying a home amidst the economic uncertainty.


However, the floodgates opened once the property market lockdown was lifted in May/June 2020. The number of properties coming onto the market in June/July/August 2020 in the UK rose by 27.1% above long-term averages for the time of year, yet the number of homes selling also rose.


In Huddersfield, in the 20 months between May 2020 and December 2021, the average number of Huddersfield homes selling was 338 per month (one month, it even hit the heady heights of 484 homes sold stc). Yet, the number of homes for sale steadily dropped throughout that period to an all-time low of just 742 homes for sale in December 2021.


 What stands out during this period is that despite the reduced number of Huddersfield properties for sale, the number of properties sold remained robust. This surge in demand, despite a drop in available Huddersfield homes, can be attributed to the combination of pent-up demand and the government's intervention in the property market, mainly the stamp duty holiday, which incentivised buyers to move quickly.


As the dust started to settle from 2021 and as we moved into the first half of 2022, the property market started to feel like it was coming back to a ‘normal property market’ as the number of homes selling settled down and the general level of properties for sale also steadily began to rise.


However, just as we returned from our summer holidays in 2022, the Huddersfield property market was badly hit twice in a 12-month window.


The first hit was the Truss Budget in late 2022. In the five months following that budget, the average number of Huddersfield home sales dropped to an average of only 196 sales per month. It started to recover in the spring of 2023, as home sales rose to an average of 272 sales per month, only to be hit again when the increasing interest rates started to bite in the summer of 2023. Home sales in Huddersfield slumped to only 234 sales per month in the summer months of 2023.


Number of Huddersfield Homes for Sale Surge After January 2024


Since January 2024, the number of Huddersfield homes selling has been at an average of 298 homes sales per month, yet here is a fly in the ointment: the number of homes for sale has steadily risen to 1,804 in August 2024 alone.


This significant increase in supply could be due to various factors, including homeowners taking advantage of high property prices, an increase in new builds, or a growing number of properties that failed to sell in previous months being relisted.


Percentage Proportions: Huddersfield vs. UK Trends


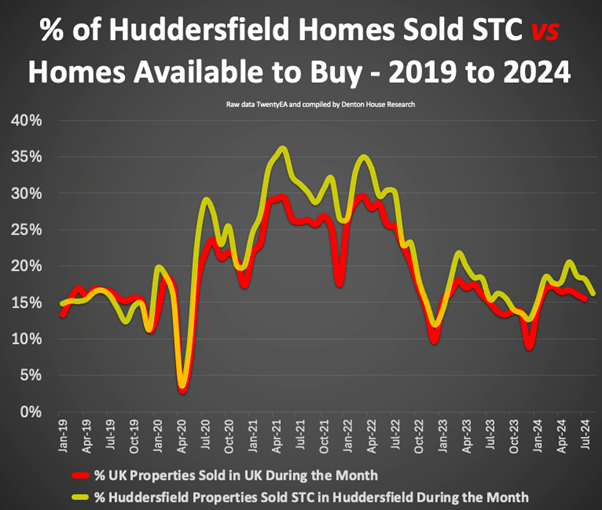
The second graph, set against a black background, delves deeper into this dynamic by comparing the same set of numbers against each other and expressing them as a percentage.


By doing that, we can analyse the proportion of monthly homes sold relative to the number of properties available.


The yellow line on the graph represents the percentage of Huddersfield properties sold SSTC during the month as a proportion of the homes for sale, while the red line for interest shows the equivalent figure for the entire UK.


This graph reveals quite telling information. Throughout 2020 and into early 2021, the proportion of homes sold in Huddersfield (yellow line) spiked into the mid-30%. This aligns with the earlier observation that, despite fewer homes being available, a higher percentage of these homes were being snapped up by eager buyers following the pandemic.


However, as we moved into 2022 and beyond, this trend began to reverse. The proportion of homes sold (as a percentage of the homes for sale) in Huddersfield started to decline, and now the figure now stands around the mid-teens.


What does it all mean for Huddersfield home movers?


The stable number of home sales against a backdrop of increasing supply could signal a potential issue: the market may be approaching a tipping point where supply begins to outstrip demand.


Given these trends, it’s clear that Huddersfield homeowners looking to sell their properties need to be mindful of the market dynamics. With the number of homes for sale having nearly doubled since mid-2022, competition among sellers is fiercer than in recent years. While buyer demand remains strong, it has not increased at the same rate as the supply of Huddersfield homes on the market, which could lead to longer times on the market and, potentially, downward pressure on prices.


In such a market, pricing becomes crucial. Huddersfield homeowners who are serious about selling need to ensure their properties are competitively priced to attract buyers.


Overpricing in a market with abundant choices could result in Huddersfield properties languishing unsold for extended periods. On the other hand, a realistic and attractive price point could make all the difference in securing a swift sale.


Also, remember that the longer a home takes to sell, the greater the chance the sale will fall through even when the sale is agreed upon. Looking at an examination from Denton House Research using data from TwentyEA, they noted that if a UK home sold within 25 days of the property coming on the market, the homeowners had a 94% chance of getting the sale through to completion (i.e. moving) with only a 6% chance of the sale falling through. If, however, the sale was agreed upon in more than 100 days, the chances of actually completing that sale and moving reduced vastly to only 56%, with a 44% chance of the sale falling through.


In conclusion, while the Huddersfield property market remains active, available homes have nearly doubled since mid-2022, this has introduced a new challenge for sellers. To achieve a successful sale, Huddersfield homeowners must pay close attention to market trends and set their prices accordingly. Realistic pricing and an understanding of the broader market dynamics will be vital in navigating this evolving landscape. As the data suggests, the market is still healthy, but the balance between supply and demand is shifting, making strategic pricing more critical than ever.